
In 2016 I was diagnosed with gout and in 2019 I was diagnosed with prediabetes. I had no idea that gout and prediabetes were perhaps manifestations of the same central condition in metabolic dysfunction: systemic inflammation.
At the time I had no idea that issues like systemic inflammation could be reversed by eliminating sugar and alcohol, cutting back on carbohydrates, and eliminating processed food. Once I realized that I could reverse my prediabetes by lowering fructose and hyperglycemia, I reversed my prediabetes in 52 days on the ketogenic diet and put my gout in remission.
However, during the last three years on the ketogenic diet (less than 50 grams total carbs per day) I saw my uric acid spike in the early months and then stabilize at ~ 7mg/dL uric acid. I also experienced a minor flare four months into the low carb lifestyle, and then again recently when I started taking allopurinol. It was this experience that brought a number of questions into my mind concerning the condition of gout.
Why were the two flares minor compared to my gout attack in 2016? On the ketogenic diet the pain scale was a 1 or 2 compared to a 10 pre-ketogenic. Why does it seem that the long term ketogenic diet reduces the likelihood of a gout flare or at least reduces the intensity of the flare?
In May of 2020, approximately one year after my prediabetes diagnosis, I published a video on our YouTube channel, Dr. Pete’s Keto Klub, called Gout and the Ketogenic Diet. This video was a commitment to the community that I was going to try and understand the core underpinnings of this debilitating disease: Gout.
What is the root cause of gout?
Its important for you to understand that I am asking about a root cause of gout as opposed to asking about how gout is managed once you have it. Here is what the American College of Rheumatology has to say about gout in their 2020 guidelines:

The central philosophy of this document is endpoint treatment of the gout flare. The document also promotes lifestyle changes like reducing purine rich meats, high fructose corn syrup, alcohol, and weight loss shown below:

Please note that this table appears late in the guidelines followed by first priority drug treatments. When these recommendations are compared to the American Diabetes Recommendations for the management of diabetes they are similar in scope and philosophy. The question I have is, “What is the cause of gout?” and, “Can something be done to reverse the root cause?”
The answers to these two questions matter because preventing the gout condition in the first place should trump managing the end result. The idea that gout is progressive and is a disease to be managed is problematic because this philosophy fails to address the possibility of remission or reversal of the condition.
To be certain about it, the recommendation to limit alcohol, fructose corn syrup, and purine rich meats are good recommendations. You will see if you read this document carefully that the science drives us to the same conclusions made by the standard of care but the following gout hypothesis leans on the science for a protocol to put gout in remission.
So let’s dive into a hypothesis of Gout!
Gout is the end point of a set of highly complex mechanisms that when occurring together can cause the gout flare. Understand that what I am suggesting is to think about gout as a process rather than a disease that is caused by one mitigating factor that can simply be treated by taking a pill. Taking the pill treats the symptom not the underlying cause. The same argument can be made for diabetes and cardiovascular disease.
I’m not suggesting that gout does not have a genetic component nor am I suggesting that there cannot be non-metabolic reason for this disease, just that these other possible drivers of gout may be in concert with or accentuated by a metabolic driver which depends on a cascade of factors. Remember that if you want to solve a problem you have to understand what the problem is, otherwise you are just throwing rocks in a darkened room hoping for a random outcome. I believe that gout is the end result of a coalescence of factors that result in a flare along with other metabolic disease outcomes that can happen simultaneously with diabetes and/or cardiovascular disease.
Gout is not a sliver in your finger type ailment. This way of thinking about gout is simplistic and leads to the concept that gout can be treated with a pill.
Since uploading Gout and the Ketogenic Diet I have read 100’s of research papers, interviewed top metabolic experts, and have developed a hypothesis of gout and a plan for remission that is based on lowering systemic inflammation and blocking the assembly of the gout specific inflammasome. The main feature of this intervention is the elimination of sugar and alcohol and the reduction in carbohydrates as a lifestyle goal.

Historically, gout was a disease of the rich (Rivard, C., et. al., 2013). An ailment of kings and queens because they were the only ones who could afford the sugar, honey and alcohol. It wasn’t until the world economies started to even out that the middle and lower classes could afford the sugar and alcohol and gout took hold of the population along with diabetes and obesity.

Modern statistics indicate that there are approximately 8 million gout sufferers in the US which represents about 4% of our population (Zhu, Y., et. al. (2012)). There are 43 million people with hyperuricemia (high uric acid) and most are not gouty. When the joints of some of these individuals are aspirated, sodium urate crystals can be found, yet these people are asymptomatic for gout. This means that uric acid (mono sodium urate) alone is not sufficient for a gout attack. There are likely other factors involved in the initiation of a gout flare.
Additionally, the mean concentration of uric acid in persons suffering from a gout attack is 8.3 mg/dL. The reference range, often touted as the normal range of uric acid, is between 4-8 mg/dL. A full 18% of gout suffers have uric acid values between 6-8 mg/dL and 14% have uric acid values less than 6 mg/dL. This means that you can have a “normal” uric acid value in the midst of gout flare.
Taken together, uric acid (monosodium urate) alone is not sufficient for a gout flare.
What is the connection between hyperuricemia, gout, type 2 diabetes, obesity, and cardiovascular disease?

In this figure we can see the correlation between the gout condition and chronic disease. We find that gout sufferers also suffer from high blood pressure, obesity, type 2 diabetes, heart attack and stroke. When the hyperuricemia column is compared to the gout column you can see that the hyperuricemia associations are in the form of a stepping stone which suggests that perhaps exposure time is a factor determining when someone who has high uric acid becomes gouty?
Many of us believe that Metabolic Syndrome, and its driving force of Insulin Resistance, is the central driver of metabolic disease and gout. Collectively the constellation of biomarkers that precede full blown metabolic disease are shown in the figure (Cornier, M.A., et. al. (2008); Nakagawa, T., et. al. (2005)).
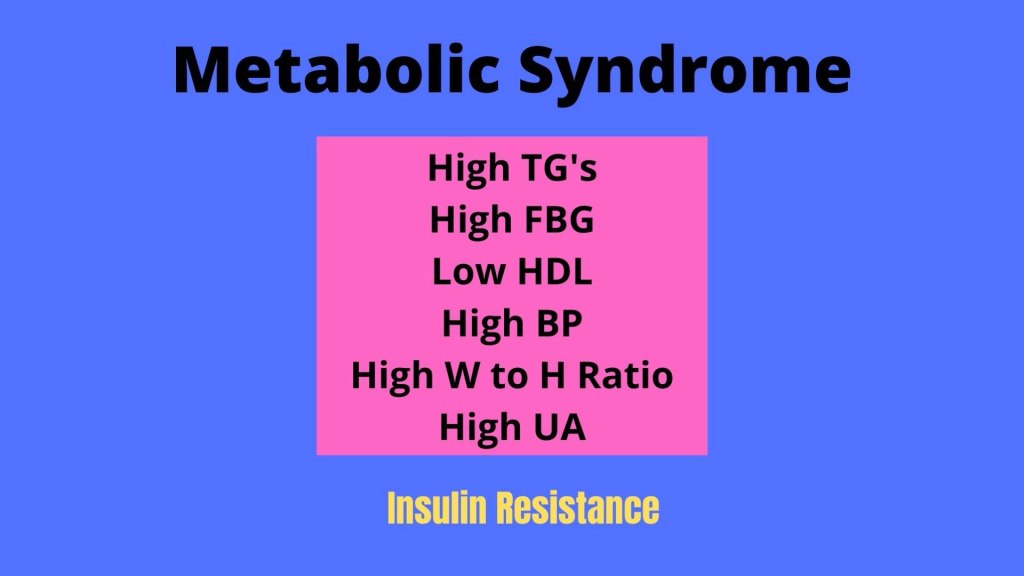
People that suffer from metabolic syndrome usually have high Triacylglycerols (triglycerides = TG’s; greater than 150 mg/dL), an HDL of 40 mg/dL or less, a high fasting glucose (above 99 mg/dL), an A1C equal to, or greater than 5.5%, elevated blood pressure, a high waist circumference to height ratio, and high uric acid (greater than 6 mg/dL).
The fact that we can reverse metabolic syndrome by eliminating sugar and sugar derivatives like high fructose corn syrup (HFCS), along with reducing carbohydrates suggests that insulin resistance is the driving factor behind chronic disease and the fact that these diseases (ie. type 2 diabetes, obesity, cardiovascular disease, gout) can reverse or improve under the same conditions required to reverse metabolic syndrome.

Therefore, if we think about a hypothesis of gout and its basic requirements, a plausible set of four factors might drive a gout flare:
- Uric acid
- Systemic Inflammatory Response
- Formation of the NLRP3 inflammasome (experimental evidence)
- Other Components or effectors?
A relevant gout hypothesis easily arises from the fructose-uric acid model of type 2 diabetes, obesity, and cardiovascular disease first proposed by Dr. Richard Johnson and supported by a large body of experimental and clinical data that has accrued over decades of work from a number of different laboratories (see figure below).

At the heart of the fructose-uric acid hypothesis of chronic disease is the fact that when fructose is metabolized its processing causes a dramatic decline in intracellular ATP and phosphate and produces an acute rise in intracellular uric acid which among other things causes mitochondrial dysfunction and insulin resistance. The global effects of intracellular uric acid are summarized in this figure.
The global effects of intracellular uric acid are summarized in this figure.

When Johnson’s body of work, over several decades, and hundreds of publications is scrutinized closely there is strong data that includes animal studies, human tissue culture studies, and clinical data that implicates uric acid as a signaling molecule and driver of chronic disease and may well be one of the main drivers of insulin resistance.
Additionally, Dr. Robert Lustig, has summarized the global effects of alcohol and fructose in the context of what I call Simultaneous Excessive Calories. This is a situation that may exist during a Standard American Meal where large quantities of alcohol, fructose and glucose arrive at the liver in a short time frame and overwhelm the liver (Lustig, R.H. (2013)).
Before moving forward, I think it is important to talk about fructose. Fructose is a carbohydrate that is significantly sweeter than glucose and is a major component in table sugar (50% by weight), high fructose corn syrup (greater than or equal to 55%), honey, agave syrups (can be greater than 90%) and the majority of processed foods. In table sugar, fructose and glucose are bonded together in the form of sucrose which is broken down by the intestine into fructose and glucose.

The other forms of sweeteners (ie. HFCS, agave, honey, etc.) are mixtures of fructose and glucose that are not bonded whose percentage differences of fructose and glucose depend on how the manufacturer combines the two sugars.
There is no good or bad when it comes to choice in the context of chronic disease reversibility: all sugar and sweeteners should be eliminated because of the deleterious effects of the fructose and the additional glucose-mediated insulin resistance caused by glucose and the formation of endogenous fructose from high glucose via the polyol pathway (Yan, J. (2018)).
However, HFCS’s and Agave have a significantly greater effect than table sugar when ingested because of the significantly higher fructose load and no need for processing at the level of the intestine. It is also important to recognize that the hyperglycemic effect of table sugar and the other mixtures also contributes to the fructose load through the production of endogenous fructose by the polyol pathway which explains why diets that just eliminate fructose, but remain hyperglycemic, fail to reverse diabetes, obesity, and cardiovascular disease.
In the next figure I have listed three substances and one activity that raise intracellular and extracellular uric acid in priority of their effects. The top two substances, fructose and alcohol, have the greatest effect on intracellular uric acid causing a sudden, acute rise within the cell where they are metabolized.

Protein, whose source is animal or plant, is broken down to provide purines that are then degraded to produce uric acid. Exercise, predominantly high intensity training and strength training, also produce uric acid due to the degradation of endogenous purines. The contribution of protein and exercise to uric acid production is secondary to fructose and alcohol. The timing and amount of these macronutrients reaching the liver matters.
To lay the ground work for the gout hypothesis we need to consider a typical Standard American Meal and explore the concept, Simultaneous Excessive Calories, to see how fructose, alcohol, and glucose generate the intracellular uric acid conditions that can cause a gout flare.

In this model we have a guy who goes into a pizzeria and orders a couple of beers, large sausage pizza, cinnamon sticks, and a loaded salad. The meal will be consumed in a relatively short period of time—maybe two hours. The idea is to think about what happens in the context of the liver as the alcohol, fructose, and glucose arrive for processing at the same time. The issue is that these macronutrients arrive at the liver in large loads in a short time frame and overwhelm the metabolic pathways used to process these macronutrients.
The beer will provide potentially all three of the primary drivers of intracellular uric acid: glucose, fructose, and purines. First, let’s address the alcohol.
80% of the alcohol arrives at the liver, 20% is processed elsewhere. Realize that beer has an alcoholic component as well as the components mixed with the alcohol (ie. water, maltose, protein = purine, HFCS, corn syrups).
If the beer was fermented using maltose then there will be a large glucose load that will contribute to the hyperglycemic condition of the liver. Additionally, beer manufacturers have started using high fructose corn syrup and corn syrups in the brewing process which means that beer can also have HFCS or CS in the final product (see figure below). The amount of corn syrup or HFCS remaining in the beer would depend on the extent of the fermentation. Therefore, beer can have a fructose load in addition to the glucose load that is mixed with the alcohol.

Lastly, it is also known that beer provides a purine load that will also contribute to uric acid production in the liver.
Some of you may be saying, “Wait, Dr. Pete, I don’t drink alcohol.”
Instead, consider a person who orders a couple of sodas with the meal. In this case, the outcome is the same because the soda contains a large load of cane sugar or HFCS that is metabolized in parallel to alcohol where the final outcome is the intracellular sudden, acute rise in uric acid that is comparable to the alcohol effect (Lustig, R.H., (2013)).
Moving to the pizza: the crust will have a large glucose load along with HFCS or sugar since the dough will also have sugar additives in addition to the glucose contribution from the refined flour.
The pizza sauce will have both glucose and fructose in it because of the components in the sauce mixture in addition to added sugar or HFCS.
The sausage will be a mixture of meat and fat along with the spice mixture that usually will also contain sugar or HFCS. The meat will also provide a purine load that is secondary to the sugar.
Moving to the cinnamon sticks the dough will be a large glucose load and fructose due to added sugar or HFCS. There will also be the coating on the outside of the bread sticks that contain sugar or HFCS.
Finally, the loaded salad will most likely have croutons in it plus a dressing that will have a sugar or HFCS. The croutons will have a glucose load plus sugar or HFCS. The dressing will also be loaded with highly refined seed oils that are known to contribute to metabolic syndrome but are beyond the scope of this article.
Putting all of this together we have a large load of alcohol, glucose, and fructose arriving at the liver in a short period of time. This is the concept of Simultaneous Excessive Calories and works to overwhelm the liver and its metabolic pathways. This is the general condition of the liver in people eating the Standard American Diet who are consuming a high sugar and carbohydrate meal 5 or 6 times per day, chronically express insulin and intracellular uric acid for the majority of a twenty-four hour period, day-in and day-out (Paoli, A., (2019)).
To understand the effect of the Standard American Meal on the production of intracellular uric acid we will start with glycolysis, the main biochemical pathway that processes glucose.

20% of the glucose load lands at the liver. The other 80% will be distributed to other organs including skeletal muscle, brain, kidney and even including the cartilaginous joint cells called the chondrocyte. I want to emphasize that in the relatively short time course of the meal, this is a hyperglycemic event and insulin expression will be high in response to the glucose.
The glycolysis pathway will be completely full due to mass action (see figure). There will be an excess of glucose entering the pathway and the lactate to pyruvate ratio will be close to 10:1 with lactate being the dominant product (Rogatzi, M.J., (2015)).
Glycolysis is heavily regulated by feedback mechanisms which maintain ATP balance in the cell. Under the hyperglycemic conditions of the meal, the pathway is occupied, there is a pool of excess glucose at the start and a pool of lactate and pyruvate at the end with a strong insulin response in the background producing hyperglycemic insulin resistance.
The fate of the lactate is two fold. First, it can cross the first mitochondrial membrane where it can be converted to pyruvate which can be processed for energy in the matrix of the mitochondria.
Secondly, lactate can be transported to the circulation where it can be utilized by other tissues for energy production or excreted by the kidneys thereby competing with uric acid for excretion causing a rise in extracellular uric acid. The rise in uric acid due to this lactate contribution could be important and will contribute to the load caused by alcohol and fructose (described below).
Lastly, the fact that we have a hyperglycemic event and a pool of glucose means that the polyol pathway is activated and endogenous fructose is produced within the hepatocyte. This contribution of fructose will be processed to uric acid and is a significant intracellular rise in uric acid. (Yan, J. (2018)).
Turning to fructose we have 60-70% of the fructose load falling on the liver. 30-40% may fall on the kidneys and other tissues where fructose will be processed causing systemic over activation of fructose metabolism.
Of note is the fact that fructose enters the liver in an unrestricted manner and is converted to fructose-1-phosphate by fructokinase without feedback control.

This means that all the fructose coming into the liver is converted into fructose-1-phosphate which causes an acute decline in intracellular ATP and phosphate to produce AMP. The AMP activates AMP Deaminase which through a series of steps produces a sudden, acute rise in intracellular uric acid. The sudden rise in uric acid causes a decrease in mitochondrial function, down regulation of the nitric oxide pathway, and produces insulin resistance.
The fructose-1-phosphate goes on to form dihydroxyacetone phosphate and glyceraldehyde-3-phosphate to activate de novo lipogenesis with the formation of oil droplets in the liver (fatty liver) and triglycerides that are shipped into the blood.
The fructose-1-phosphate also activates the transcription factor, JNK1 and initiates the inflammatory cascade that is crucial to a gout flare (see below) and liver inflammation. This process also includes the activation of the cytokine IL-1beta (Dinarello, C. A., (2010)).
To summarize, fructose is processed by the liver’s lipogenic pathway and causes liver inflammation and insulin resistance (Lustig) and most importantly, causes a sudden, acute rise in intracellular uric acid.
But the story doesn’t stop with the processing of exogenous fructose. Don’t forget that we have a hyperglycemic event happening at the same time as the fructose is being processed which activates the polyol pathway to produce endogenous fructose from the pool of excess glucose (Yan, J. (2018)). The endogenous fructose is processed alongside the exogenous fructose to produce a sudden, acute rise in uric acid, de novo lipogenesis, the inflammation cascade, and insulin resistance.

In the fructose we have a substance that produces a profound, dosage dependent effect on the liver that flips a biological switch to lipogenesis, systemic inflammation, insulin resistance, and can drive a gout flare under chronic activation of these pathways.
Now let’s consider the alcohol. 80% of the alcohol lands on the liver with other 20% landing on other organ systems. Like fructose, the alcohol enters the liver in an unregulated manner and is fully processed without feedback mechanisms. In this slide you can see that the alcohol is converted first to acetaldehyde (toxic) and then to acetate with several acute effects.
First, we have the formation of two molecules of NADH. Consider the NADH to operate like molecular money that feeds into the equilibrium between pyruvate and lactate driving this reaction to favor an increase in the proportion of lactate most likely greater than 10:1 lactate-to-pyruvate normally found in the hepatocyte (Rogatzi, M.J., (2015)).
Excess lactate will enter the blood, where, when it reaches the kidneys, it will be excreted into the urine. Lactate is an organic acid that competes with uric acid for excretion into the urine and so the extracellular UA backs up and rises in the circulatory system. This is the first of three uric acid effects due to alcohol.
Before moving on to the next two effects I need to point out that the inflammation effect with alcohol is driven at the level of the acetaldehyde that activates the inflammatory cascade and JNK1, which, as mentioned earlier has implications for the gout flare among other effects (Hotta, N., et. al. (2020); see ref. in figure above).
Now I want to direct your attention to the fate of the acetate. In this slide the acetate is converted to acetyl-CoA in a two step mechanism that requires the hydrolysis of ATP to AMP within the mitochondrion. The AMP activates AMP deaminase and in a series of steps produces uric acid within the mitochondrion. The intra-mitochondrial uric acid decreases mitochondrial function leading to insulin resistance. This is a profound, acute rise in uric acid and is the second way that alcohol contributes to uric acid via a direct production effect.
Another possible effect of the acetate is a direct activation of the innate immune system through the combined exposure to ethanol and acetate. This process would happen in concert with fructose effects and function to activate the pro-inflammatory cytokines within the macrophage. (Kendrick, S. F., (2010)).

Remember that at the same time the alcohol and fructose are being metabolized that we also have the hyperglycemic event occurring in the background. Alcohol activates the polyol pathway producing endogenous fructose contributing to the sudden, acute rise in intracellular uric acid.
To summarize, alcohol may contribute to a profound rise in uric acid by four different ways: 1) by lactate competition, 2) direct production by the processing of acetate, 3) and the polyol pathway, 4) activation of the cytokine inflammatory response.
No argument about uric acid production would be complete without talking about protein.

Sources of protein contain biological cells and cells contain RNA and DNA that are broken down to produce purines that can be broken down to produce uric acid. I believe that while the consumption of protein contributes to the uric acid load it is secondary to fructose and alcohol. The long term correlation of protein with gout is not a strong as it is for fructose and alcohol. Historically, if you analyze chronic disease in native peoples like the Inuit who subsisted on a diet of meat and fat, gout was rare compared to its prevalence in our society. The protein question mainly falls on moderation and avoidance of chronic eating patterns (eg. eating large quantities of anchovies while drinking beer is probably not a good idea.)
I think we need to take a global view of the metabolism of alcohol, glucose, and fructose with regard to the production of uric acid. In the Standard American Meal that I described as an example we have a large load of glucose, alcohol, and fructose arriving at the liver at the same time. By eating this way 5-6 times per day (Paoli, A., (2019)), high intracellular uric acid is chronically maintained, de novo lipogenesis is optimized, and a chronic systemic inflammation is elevated as the status quo.
If this process can be localized to a cartilaginous joint, then a gout flare can occur. Let’s review what we now know about the fundamentals of a gout flare:
Gout Hypothesis
- A sudden acute rise in intracellular uric acid.
- Activation of systemic inflammation with JNK1 and IL-1beta
- Activation of the NLRP3 inflammasome
- Effectors?
The question is, how do we get to the joint?

For this part of our argument we now move to the chondrocyte which is an important cell type found in the cartilaginous joint (see above). The chondrocyte is a specialized cell that provides nutrients along with specialized proteins and other important biological molecules to the working joint. Finally, the chondrocyte is bathed in synovial fluid which provides a medium for lubrication and nutrients in a healthy working joint.
Small molecules like glucose, fructose, lactate, and uric acid (Wangkaew, S., et. al., (2014)) are found in the synovial fluid in comparable concentrations to the plasma (Cajori, F. A., (1927)). Additionally, electrolytes and other small molecules are also found in the synovial fluid that are similar in concentration to plasma. So the chondrocyte has access to the same macromolecules, under similar conditions compared to the plasma conditions seen by the liver, kidney, skeletal muscle, etc.
There is substantial data going back into the mid-1900’s that indicate that these important metabolites (glucose, fructose, uric acid, etc.; Cajori, F. A., (1927)) are found in the synovial fluid in comparable amounts to the circulatory system. This is important because we know that the chondrocyte specializes in glycolysis under hyperglycemic conditions in the context of the meal described above.
Additionally, we know that the chondrocyte has the transporter, GLUT 5, which allows for the transfer of fructose inside the chondrocyte. The chondrocyte also contains the relevant glucose transporters including, GLUT 1, 3, and 9 (Fructose and Glucose; Zhang, B., et. al. (2019); Ohara, H., (2001); Mobasheri, A., (2002)). Moreover, the chondrocyte can transport uric acid inside or outside the cell (URAT1) and expresses inflammatory cascade protein JNK1 (Xu, Y., (2021) and the cytokine, IL-1beta (Dinarello, C.A., (2010).
This means that the chondrocyte, in addition to glycolysis, can metabolize fructose and can activate the polyol pathway with the acute rise in uric acid including all of its effects: activation of the inflammatory cascade by JNK1 and the activation of the cytokine, IL-1beta.
And let’s not forget the hyperglycemic conditions of the synovial fluid, the fact that the synovial fluid is hypoxic, and will also have uric acid, all of which are known to activate the polyol pathway producing endogenous fructose which will also give an acute rise in uric acid.
Laiguillon, et. al. (2015), showed that the polyol pathway can be activated in the chondrocyte under hyperglycemic conditions. Their data also showed the activation of Il-1beta, Il-6, Il-8, PGEF2, and increase in reactive oxygen species. They also showed that inhibition of Aldose Reductase mitigated the stress response.
Park, S. et. al. (2022) has shown that de novo lipogenesis is activated in chondrocytes exposed to hyperglycemia.
Blanco, F. J., et. al., (1995), has shown that nitric oxide deficiency in the chondrocyte can induce apoptosis.
Kc, R., et. al., (2015), has shown that alcohol increases chondrocyte pathology in the knee and shoulder joints of mice.
This means that we have put the first two aspects of the gout hypothesis on site in the joint: the sudden acute rise in uric acid and the activation of the inflammatory cascade along with other pathologies found in gout. I believe that Johnson’s fat switch is turned on in the chondrocyte under hyperglycemic conditions.
That leaves us to explain how the NLRP3 inflammasome is formed?
In 2017, Song, et. al. published a paper in Molecular Cell, 68, 185-197., that showed JNK1 was required to initiate formation of the NLRP3 inflammasome. So now we have everything we need for a gout flare in the cartilaginous joint: the sudden acute rise in intracellular uric acid, activation of the inflammatory cascade with JNK1 and IL-1beta initiating the assembly of the main NLRP3 inflammatory complex.

At this point in the cascade we have a chondrocyte that is stressed. The coalescence of hyperglycemia and fructose effects through the sudden acute rise in uric acid with activation of the inflammatory pathways likely releases monosodium urate and IL-1beta into the synovial fluid attracting resident macrophages and neutrophils from the innate immune system.
What about the innate immune system?
The synovial fluid contains circulating innate immune cells including the macrophage, neutrophils, and monocytes. All are capable of expressing JNK1 and IL-1beta in response to inflammatory signals. Collectively these cells also metabolize glucose and fructose and can respond to signals between cells. Therefore, in all likelihood, the innate immune system is involved through cell signaling to initiate the full gout flare.

Putting this all together I propose a model of the gout flare that requires the combination of a stressed chondrocyte that signals the innate immune system to initiate the full gout flare. The chondrocyte may well be in the dying phase with release of monosodium urate (MSU), vesicular ATP to the pericellular space along with IL-1 beta.
A more concise model of a gout flare is shown below:

To summarize: The chronic acute, sudden rise in UA within the chondrocyte causes the cell to be sick with potential cell death and activates the inflammatory cascade and NLRP3 inflammasome. MSU spills into the pericellular space with IL-1beta and activates the resident macrophages and neutrophils. The ailing chondrocyte spills vesicular ATP into the pericellular space which activates the P2X7 ATP dependent Na+, Ca++ channel and activates the NLRP3 inflammasome within the macrophages and neutrophils. The gout flare can commence.
There is at least one study that has implicated stearic acid as an effector molecule to form the inflammasome (Joosten, L. A. B., (2010)). It is the opinion of this author that there may also be other effector molecules that operate with MSU to initiate the inflammasome.
Also, the concentration of synovial fluid uric acid is higher compared to serum uric acid during a gout flare (Wangkaew, S., et. al., (2014)). This supports the notion that the chondrocyte is increasing the local, effective concentration of uric acid in the synovial fluid since moving UA from serum into the synovial fluid would be against a concentration gradient. It is my opinion that the chondrocyte induced MSU rises to an acute local level in the synovial fluid during the process of the inflammatory event. This acute rise could also have its origin in the innate immune system.
Now that we have a potential model for gout, how can we use this hypothesis to put gout in remission.
The chosen eating plan must eliminate alcohol, sugar, HFCS, Agave syrups, Honey and processed food. Protein will be monitored and will represent about 20% of the total calories. Additionally, the eating plan should lower the carbohydrates to 50 grams total carbs per day to optimize ketosis and produce betahydroxybutryate which has been shown to inhibit the assembly of the NLRP3 inflammasome. Only the carbs are counted and the lifestyle will be ~75% fat in calories.
I cannot over emphasize the importance of betahydroxybutyrate in a remission plan because of its signaling properties and dampening effect on systemic inflammation. Therefore, maintaining ketosis between 0.5 mM-3 mM with a target of an average 1.0 mM BHB is important and should be monitored using a glucose-ketone meter (keto-mojo.com). Uric acid will be monitored using a UASure meter.

By lowering the carbs, insulin expression is lowered and ketones are produced as a function of fat burning. One of these ketones, betahydroxybutyrate (BHB), inhibits the formation of the NLRP3 inflammasome.
This type of eating plan also lowers systemic inflammation which will also lower JNK1 and IL-1beta which are needed to drive the inflammatory cascade.
Therefore, the combination of a low inflammation way of eating and production of BHB provides a protective mechanism against a gout flare and should, if compliant with the lifestyle, end the pain cycle.
What are some of the potential problems going low carb with gout?
I want to address the issue of hyperuricemia. With gout, there are two types of uric acid: intracellular and extracellular UA. Remember that the mean extracellular UA in gout sufferers is 8.3 mg/dL. Also, as defined by the medical establishment, the definition of high uric acid is 7 mg/dL. It’s also important to recall that gout sufferers can have an attack with UA levels well within the “normal” reference range of uric acid (4-6 mg/dL).
The question is, what happens to extracellular UA during the transition onto the ketogenic diet and then, after keto-addaption (2-3 months or more time)?
When the ketogenic eating plan is started it is common for UA to rise (see my data below). This is because of the ketones are organic acids and under low carb, low insulin conditions, compete for excretion at the level of the kidneys with uric acid. This is why you should be under the care of a doctor because it is during this UA spike that you will be most vulnerable to a gout flare and may need to seek medical intervention.
Over the process of keto-adaption (2-3 months or more) fasting UA drops and BHB stabilizes if there is compliance with the lifestyle. Stabilization is optimized by keeping BHB on average at 1 mM by monitoring and tweaking the lifestyle in terms of the % carbs eaten. A reasonable target is to start is 50 grams total carbs per day with ketone monitoring.

You can see that in 2021 I started taking allopurinol. I made this decision because I was concerned about extracellular uric acid values at 7 mg/dL and sometimes higher.
The only gout flares that I have experienced were in the first months in the keto lifestyle during the spike and in the first month of starting allopurinol. Both flares rated as a 1 on the pain scale versus a 10 before I started the ketogenic way of eating. Otherwise, I have been gout free. My UA concentration during the allopurinol flare was 4.5 mg/dL.
It is my opinion that we are most likely most vulnerable to gout flares when UA is in flux moving up or down rather than when extracellular UA concentration is stable.
Gout Hypothesis Summary
- The gout condition is an inflammation process. A number of factors have to come together for a gout flare. MSU is required for the flare but is not sufficient. There are effector molecules that combine with MSU that activate NLRP3.
- The chondrocyte is inflamed and cross-talks with the innate immune system.
- A sudden acute rise of intracellular MSU with the inflammatory response including JNK1 and IL-1beta are implicated in this process.
- MSU, extracellular ATP, IL-1beta spill into pericellular space to activate Neutrophils and Macrophages. NLRP3 assembles and the flare commences.
- Any remission program therefore, should aim to reduce the inflammatory cascade.
- Elimination of alcohol, fructose, and hyperglycemia should be considered the top priority in any eating plan. Moderate protein that is not redundant in high purine meat is consumed.
- A ketogenic eating plan to optimize betahydroxybutryate should be prioritized to inhibit formation of NLRP3 and lower systemic inflammation as a priority.
- The gout hypothesis is parsed together from a variety of peer-reviewed sources. All, or parts of it can be wrong, and as such, will be changed as more data and research becomes available.
References Not Included In The Figures
Roughly in the order that they appear in the narrative:
Rivera, C., et. al. (2013). Sack and sugar and the aetiology of Gout in England between 1650 and 1900. Rheumatology. 52: 421-426.
Zhu, Y., et. al. (2012). Comorbidities of Gout and Hyperuricemia in the US General Population: NHANES 2007-2008. The American Journal of Medicine. 125 (7): 679-687.
Cornier, M. A., et. al. (2008). The Metabolic Syndrome. Endocr Rev. 29 (7): 777-822.
Nakagawa, T., et. al. (2005). Hypothesis: fructose-induced hyperuricemia as a causal mechanism for the epidemic of the metabolic syndrome. http://www.nature.com/clinical/practice. Nephrology. 1 (2): 80-86.
Lustig, R .H., (2013). It’s “Alcohol Without the Buzz.” Adv. Nutr., 4: 226-235.
Yan, L., (2018). Imbalance stress in diabetes mellitus: Role of the Polyol Pathway. Anim Models Exp Med., 1: 7-13.
Rogatzi, M. J., (2015). Lactate is always the end product of glycolysis. http://www.frontiersin.org., 9: 1-7.
Paoli, A., et. al., (2019). The influence of meal frequency and timing on health in humans: the role of fasting. Nutrients., 11: 1-19.
Cajori, F. A., and R. Pemberton. (1927). The chemical composition of synovial fluid in the case of joint effusion. Proc. Am. Soc. Biol. Chem., 22: 471-480.
Zhang, B., et. al., (2019). Urate transport capacity of glucose transporter 9 and of urate transporter 1 in cartilage chondrocytes. Molecular Medicine Reports. 20: 1445-1654.
Ohara, H., et. al., (2001). Immunochemical demonstration of glucose transporters in epiphyseal growth plate chondrocytes of young rats in correlation with autoradiographic distribution of 2-deoxyglucose in chondrocytes of mice. Acta Histochemica. 130 (4): 365-378.
Mobasheri, A., et. al., (2002). Glucose transport and metabolism in chondrocytes: a key to understanding chondrogenesis, skeletal development and cartilage degradation in osteoarthritis. Histol Histopathology. 17: 1239-1267.
Xu, Y., et. al., (2021). Activation of extracellular-signal-regulated kinase (ERK)/C-Jun N-terminal kinase (JNK) signal pathway and osteogenic factors in subchondral bone of patients with osteoarthritis. Am. Transl. Med. 9 (8): 1-14.
Dinarellao, C. A., (2010). How Interleukin-1beta induces Gouty arthritis. Arthritis Rheum. 62 (11) 3140-3144.
Kendrick, S. F., et. al. (2010). Acetate, the key modulator of inflammatory responses in acute alcoholic hepatitis. Hepatology. 51 (6): 1988-1997.
Wangkaew, S., et. al., (2014). A comparative study of serum and synovial fluid levels of uric acid between patients with gout and other arthritides. J Med Assoc. Thai. 97 (7): 1-7.
Joosten, L. A. B., (2010). Fatty acids engagement with TLR2 drive IL-1beta production via ACS-caspace-1 pathway to urate crystals in gouty arthritis. Arthritis Rheum. 62 (11). 3237-3248.
Laiguillon, M.-C., et. al. (2015). Characterization of diabetic osteoarthritis cartilage and role of high glucose environment on chondrocyte activation toward pathophysiological delineation of type 2 diabetes related osteoarthritis. Osteoarthritis and Cartilage. 23, 1513-1522.
Park, S., et. al., (2022). PPAR alpha-ACOT12 axis is responsible for maintaining cartilage homeostasis through modulating de novo lipogenesis. NATURE COMMUNICATIONS | https://doi.org/10.1038/s41467-021-27738-y
Blanco, F. J., et. al., (1995). Chondrocyte apoptosis induced by NO. Journal of Pathology. 146, 75-85.
Dr. Pete Gout Protocol Online Course: everything you need including meal plans, over 100 recipes, how to lessons, and more!
Dr. Pete’s Gout Remission Online Course
Dr. Pete’s Coaching Programs:
Gout Support Group–where you find free peer support:
Questions: eMail Dr. Pete directly: ketonicrevolution@gmail.com